
We built it, we tested it... Now let's learn!
There is a few tools you can use to measure the impact of pagespeed. If you're going to optimize your HTTP front boxes, you probably want to measure if it has a good or bad impact on your response time.
Interesting metrics:
- Connection time. The time an user's browser needs to establish communication with your server.
- HTTP Response Time. The time an user's browser needs to get your HTTP response (html, for example ...).
- Request-to-rendered time. The time it takes for an user to see the actually rendered page as the result of his request.
Even if all three metrics can give you very interesting insights on how your server is behaving, we'll consider here that the one metric that matters is the latest, as what we want to achieve is a better end-user experience. We want the pages to load fast, and to an user, "load" means "displayed".
A few tools...
Pagespeed Statistics
First and foremost, let's have a look at the administration and statistic tools bundled with ngx_pagespeed.
By default, they're disabled (for security reasons, you don't want to expose this to the world). Let's enable them.
# Enable statistics and statistics logging
pagespeed Statistics on;
pagespeed StatisticsLogging on;
pagespeed LogDir /var/log/pagespeed;

# Admin locations (needs to be enabled later, see admin.conf)
location /ngx_pagespeed_statistics { allow 127.0.0.1; allow 172.17.0.0/24; deny all; }
location /ngx_pagespeed_message { allow 127.0.0.1; allow 172.17.0.0/24; deny all; }
location /pagespeed_console { allow 127.0.0.1; allow 172.17.0.0/24; deny all; }
location ~ ^/pagespeed_admin { allow 127.0.0.1; allow 172.17.0.0/24; deny all; }

# Administrative modules
pagespeed StatisticsPath /ngx_pagespeed_statistics;
pagespeed MessagesPath /ngx_pagespeed_message;
pagespeed ConsolePath /pagespeed_console;
pagespeed AdminPath /pagespeed_admin;
You'll need to adjust the allowed IP so that only you or some trusted network can access it.
Two of the most interesting instruments you'll be able to access is now the nginx pagespeed's statistics...
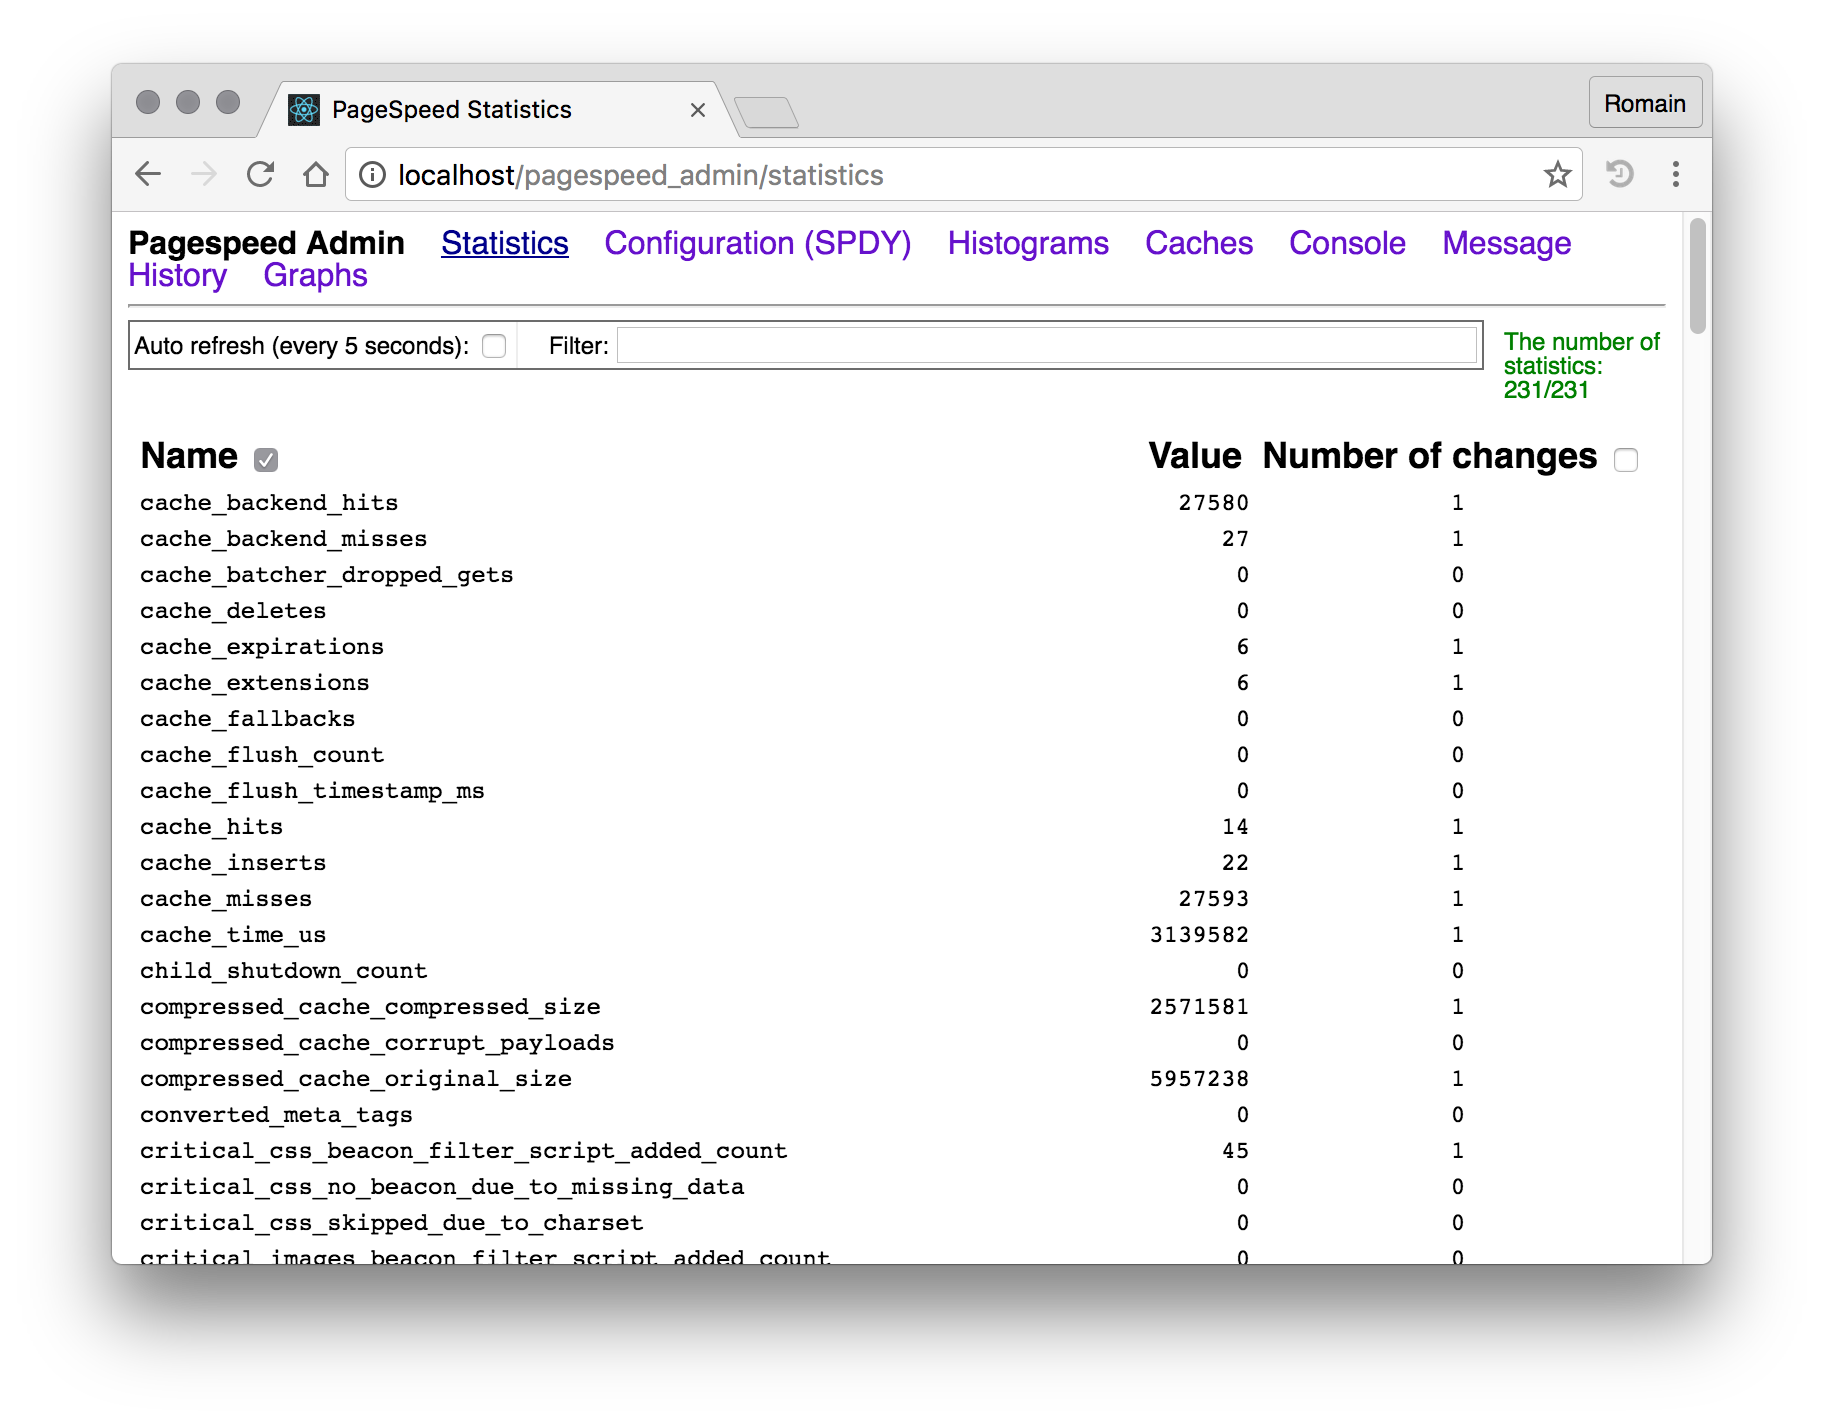
... and even more interesting, the histograms, showing amonst other timings of your real users full page load time (it is using a beacon to measure time, so you'll know how much time is spent between the server connection and the fully rendered page on client side):

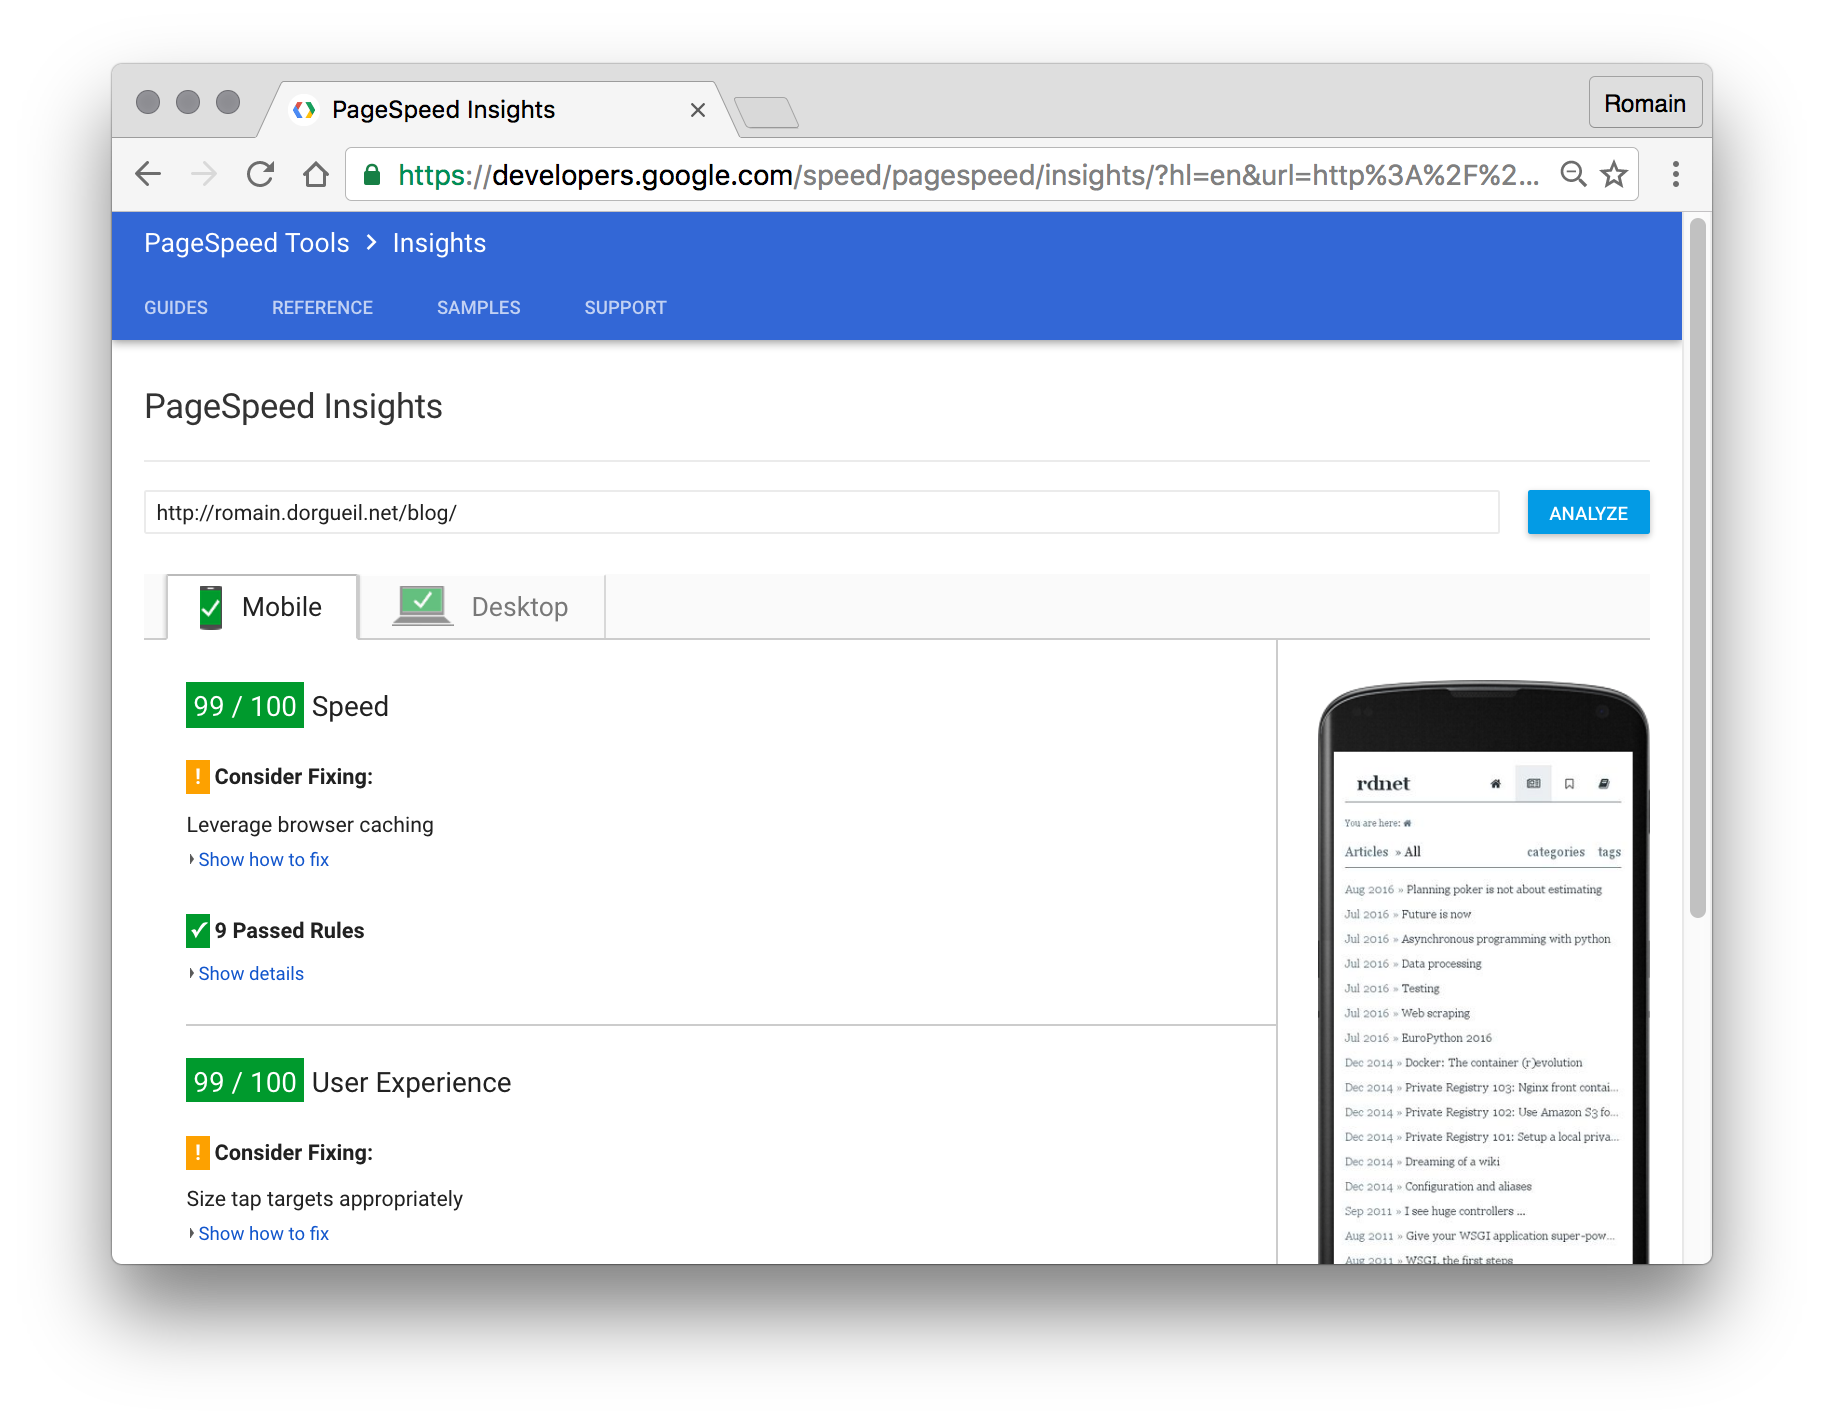
Pagespeed Insights
A great tool from google called Pagespeed Insights (not to mistake with apache module and nginx extension that we just used) allows scoring a page from 0 to 100 on a bunch of speed criteria, both for desktop and mobile usage.
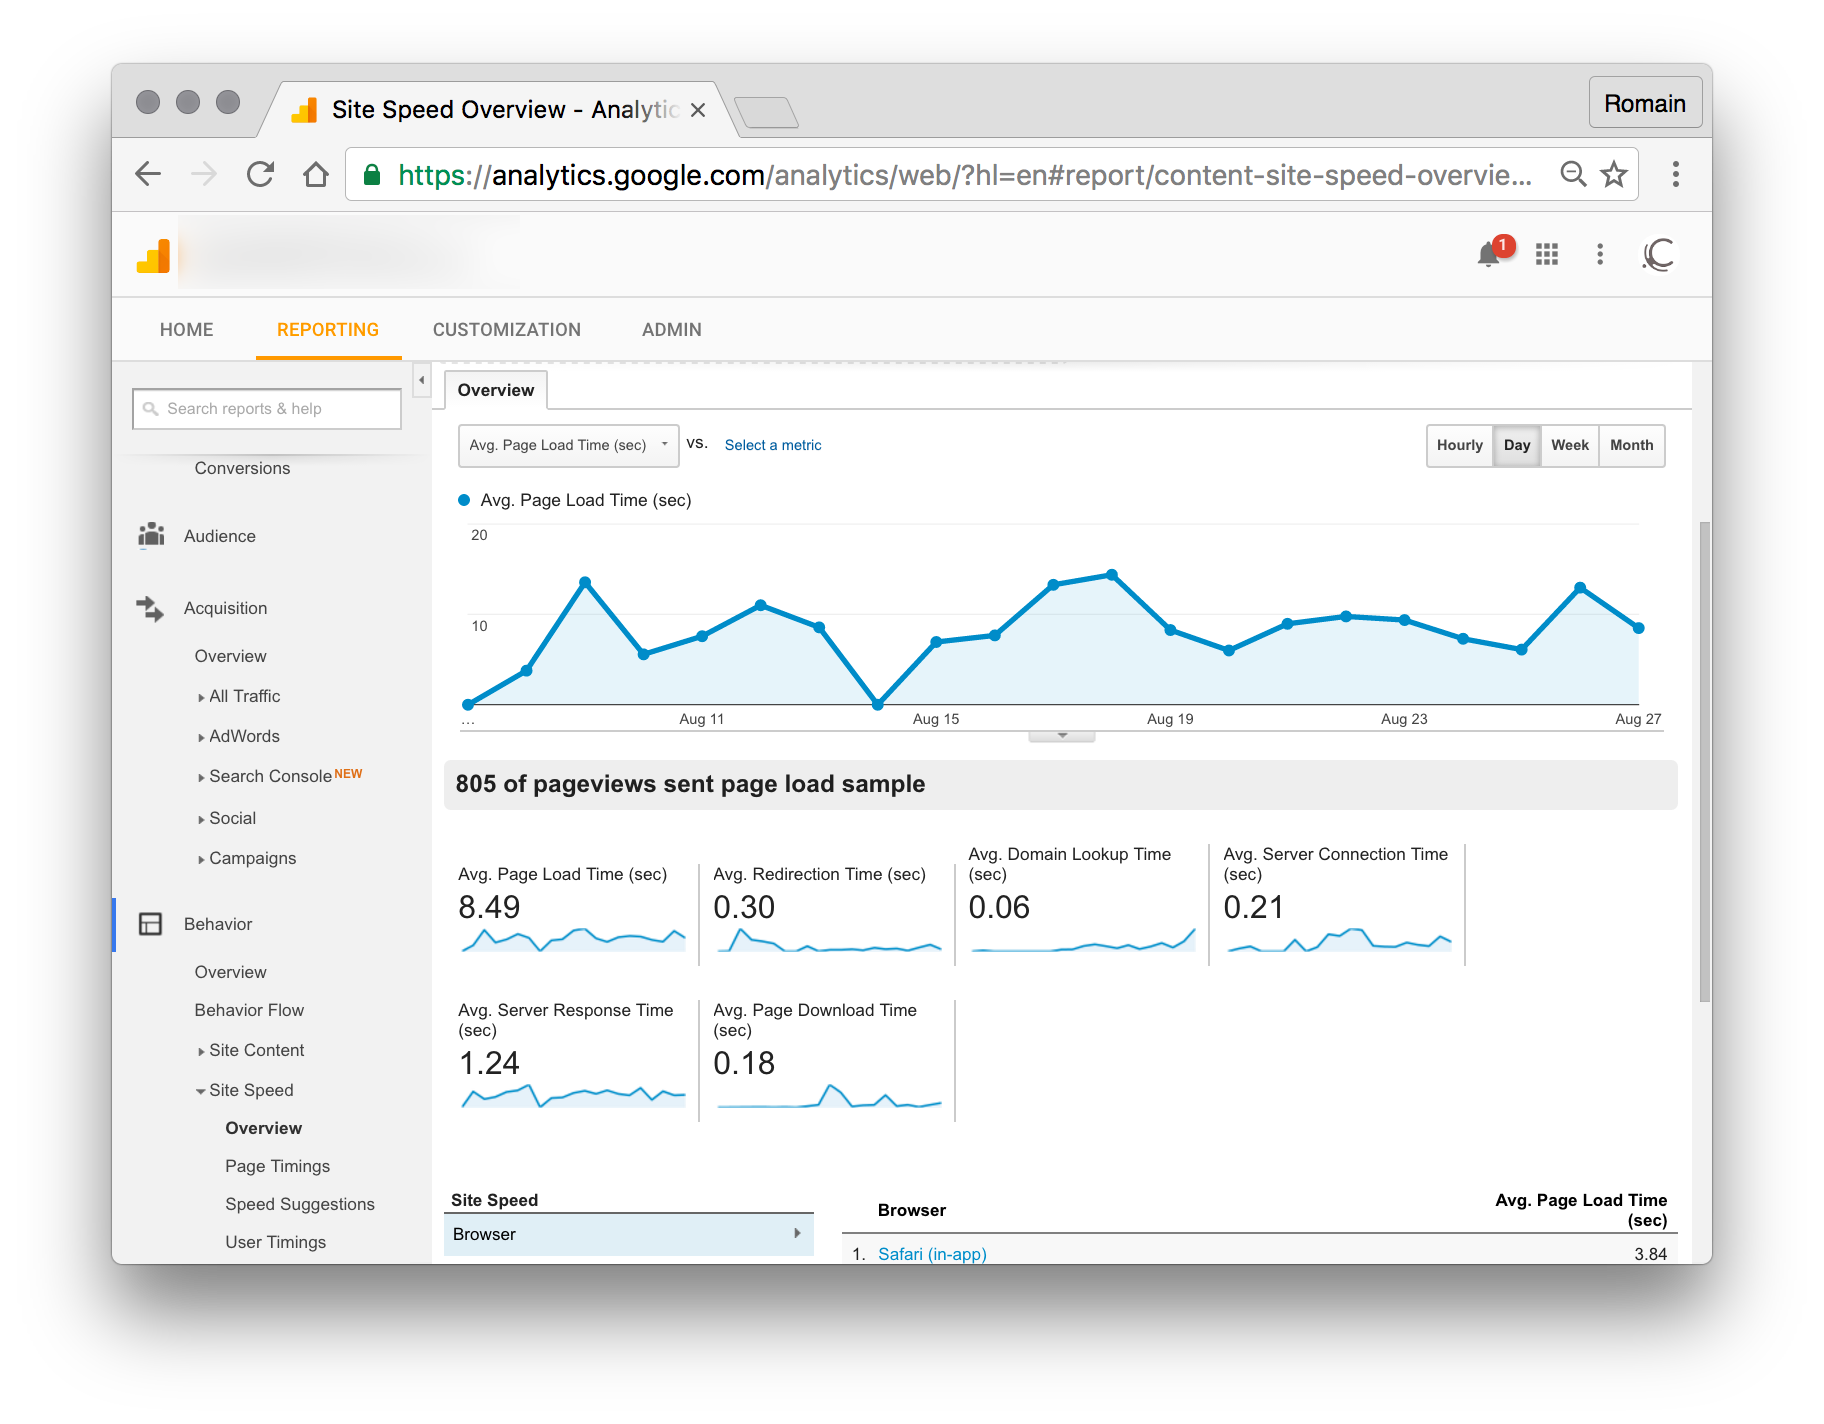
Google Analytics
I never really understood the timings shown by Analytics. However, you need to know that the tool tries to measure the speed of page display from a user point of view and records it so you can act.
Google Search Console (previously Google Webmaster Tools)
This one will have a few days of lag before updating, but going to crawl statistics will give you the average time Googlebot takes to retrieve your website's pages. Try to keep this one as low as possible (under 200ms is excellent, 500ms is acceptable, 1sec is badly lagging and more than that means that your soft needs urgent attention if you wanna do anything serious with it).
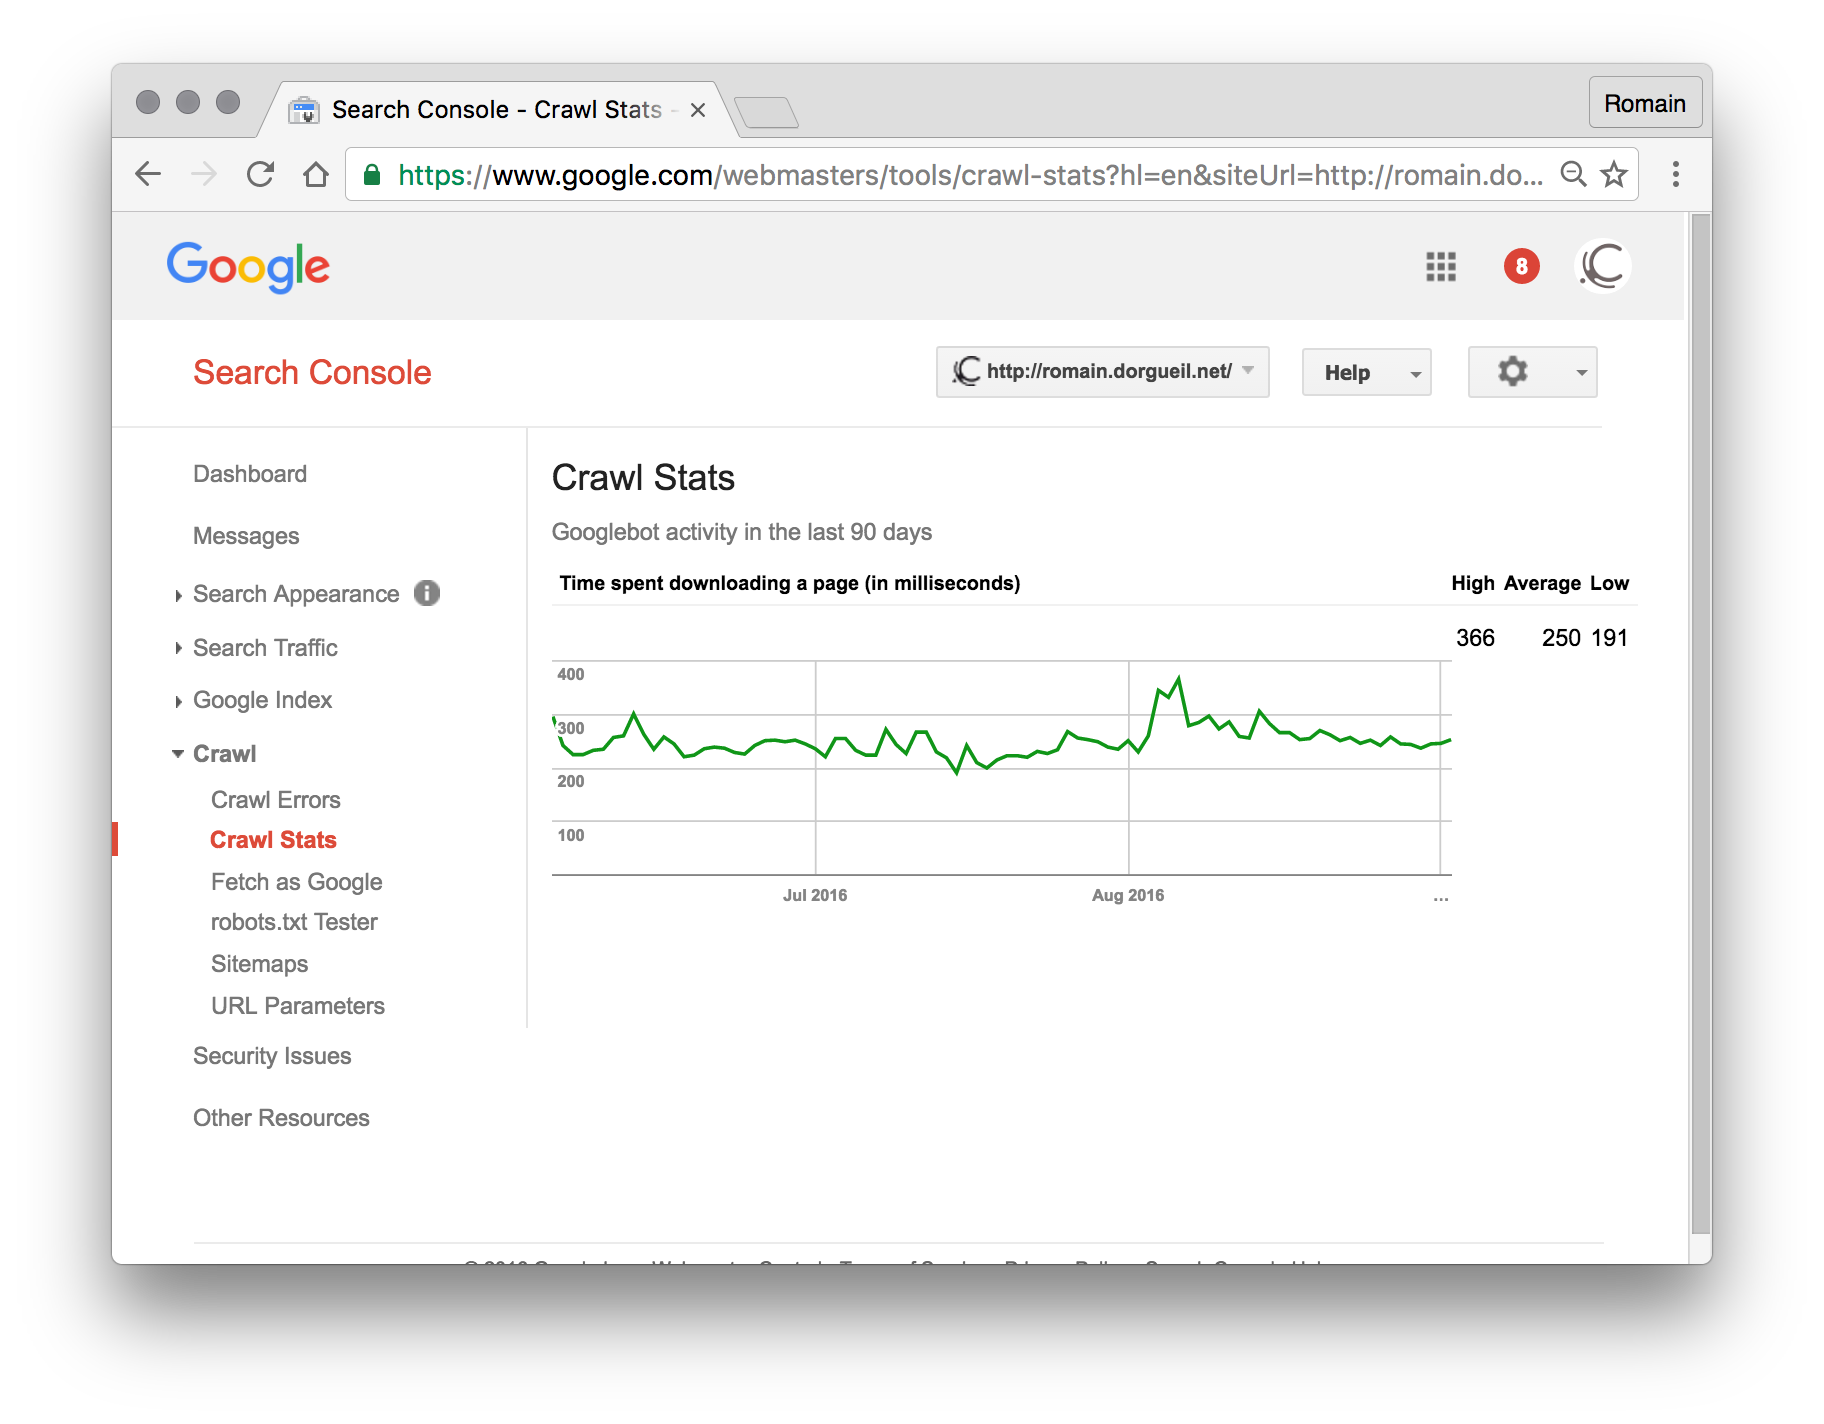
Be aware that it's not the user render time, so being fast here (let's say, 300ms) does not mean the website will feel fast for your user. Better use the ngx_pagespeed statistics to know that.
That's all folks!
End for today! I really hope you enjoyed this little serie.
Do you have some more tools for measuring? Some techniques that are missing here? Please share it in the comments, and I'll do my best to update the articles as fast as I humanly can!