Sponsors


Guide to Android DDMS - The Android Console
Development is a job for the smart. Languages keep evolving, new tools keep on popping up and requirements often appear to be in constant flux.
Still, even with all these changes, the fundamental rules stay the same. One of the most important of these underlying rules states that in order to create really awesome software, you must gain deep, ongoing and detailed introspection into your executing system. Diagnostics, debugging, and profiling are terms sometimes used in this context, but the rule goes deeper.
Android Console: DDMS
The analysis and introspection tool to rely on when crucial, accurate, and granular data needs to be extracted about the runtime behavior of our app is still the Dalvik Debug Monitor Server (DDMS) in Android Studio, which has been with us since the time of the Eclipse Android plugin.
And the point is that DDMS is so simple to master and fun to use!
Now, a large part of using DDMS accurately, just like any other software tool, comes with experience. You need to hone your professional skills for some time until you become really good at runtime performance monitoring. But even in a matter of hours, say after reading this lesson, if you follow my suggestions and apply them to your next app, the results can be amazing! Profiling and tuning even complex systems is not that hard. It can turn out to be cool and fun.
A Quick Guide to DDMS in Android Studio
Now, without more discussion, let us now dive into the description of DDMS, one of the greatest Android developer tools.
To compare effort against benefit, probably no other tool can improve the quality of your app and help you in identifying the really messy and elusive bugs it might contain. But still, for some reason, so many developers fail to use DDMS.
Let’s start with a quick look on DDMS:
DDMS is accessible via Studio > Tools > Android > Android Device Monitor and clicking the DDMS button on menu.
Once opened, this is what you’ll see:
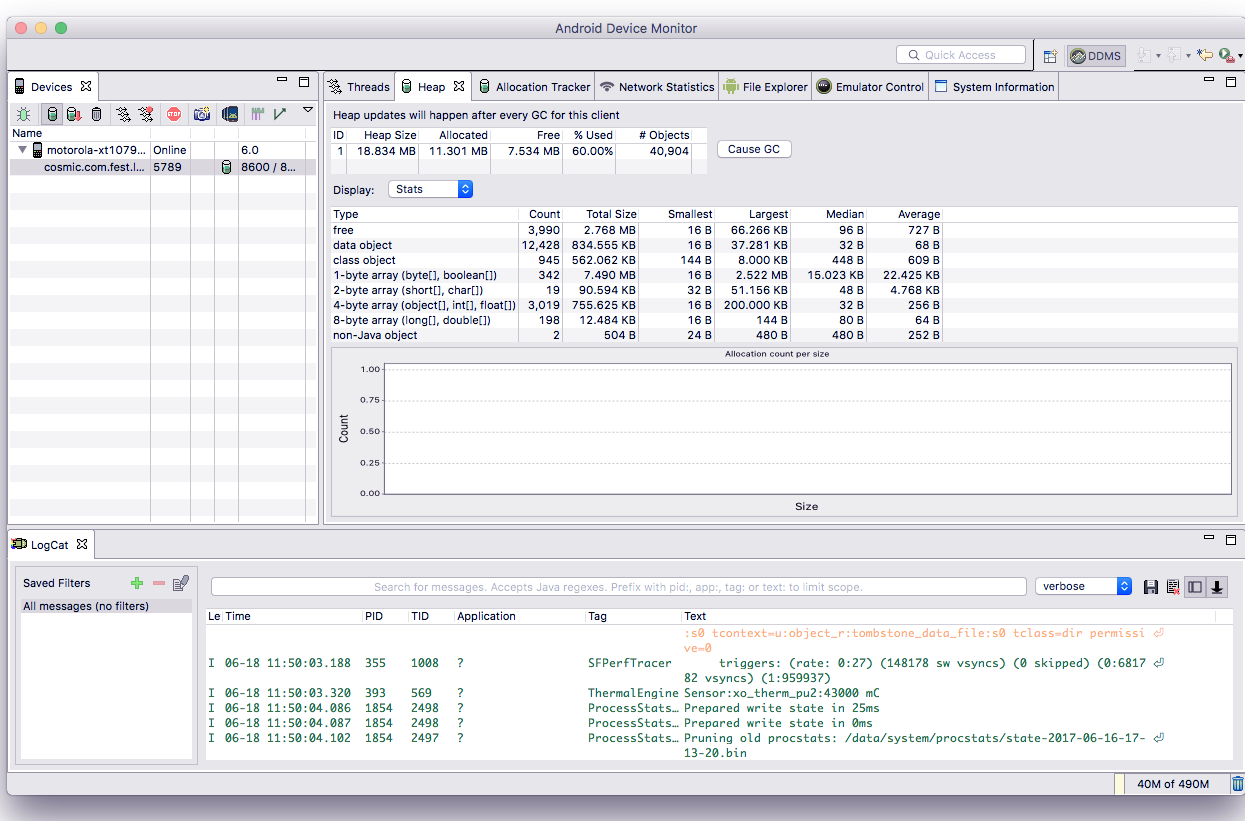
The left panel allows for device/app selection and the right console provides you will multiple views, each in its own tab, each exhibiting a specific view of your app.
The main services provided by Dalvik Debug Monitor Server are:
- App memory usage statistics (total heap and object allocation statistics)
- App thread statistics
- Device screen capture
- Device file explorer
- Incoming call and SMS spoofing
- Location data spoofing
- Logcat
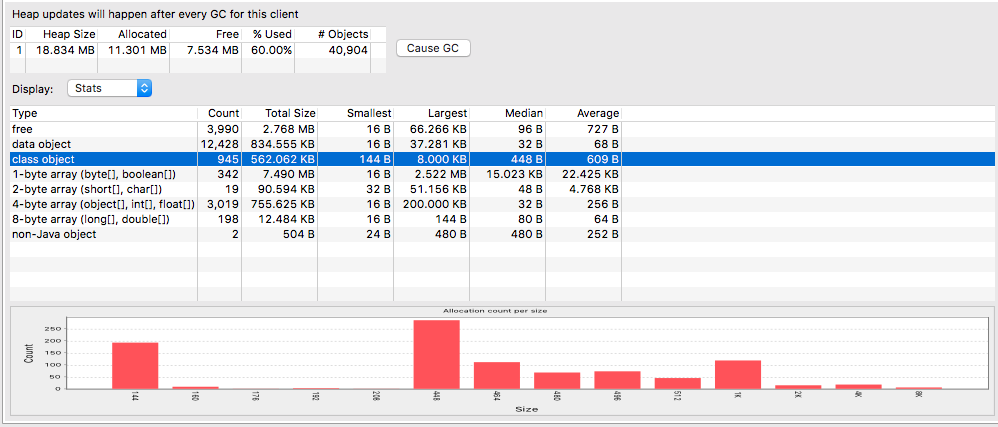
To obtain the current heap memory value used by your app, simply do as follows:
- Connect the device on which your app is running
- Click the Update Heap button to enable heap stat gathering
- Open the Heap tab
- Click “Cause GC” to force a GC run. Only after such a run will the heap data collection commence
- Keep the tab open, continue working on your app, and periodically re-click “Cause GC” to refresh the heap stats data
This last line probably requires additional explanation. Memory usage is one of those analytical values where its dynamics are way more important than the initial value. For most apps, we won’t be too concerned about the initial heap usage value. We will however pay strict attentions to the progress of this value, as it will provide us with a clear indication of one of the true nightmares awaiting mobile developers—Android memory leaks:
My usage of the heap stat module is simple; as part of the lifecycle of developing the app, after introducing changes which should impact heap usage, I will activate the module, “Cause GC” to init stat gathering, activate (usually more than once) the heap-intensive positions of my app, and periodically “Cause GC” to refresh. If the heap usage keeps growing, I have a memory leak on my hands and I need to solve it (details on how - below). If not, and regardless of the actual heap size, I’m good.
If a memory leak is detected, the next tool I will use is the Object Allocation Tracker. Let’s see what it can do for memory management in Android.
Object Allocation Tracker
The allocation tracker, simply put, will provide you with the information required to figure out who’s the party to “blame” for the current heap size. This module will tell you from which threads and methods the allocation commands came from in a real-time manner, making it invaluable for memory analysis in Android.
To commence tracking, do as follows:
- Select the relevant device/process as before
- Switch to the Allocation Tracker tab and click Start Tracking to begin.
- From here on out, all new allocations will be tracked
- Click “Get Allocations” to get a list view of all latest allocations (latest since last “begin”)
- To find out who the allocation authority is, click a specific line in the list
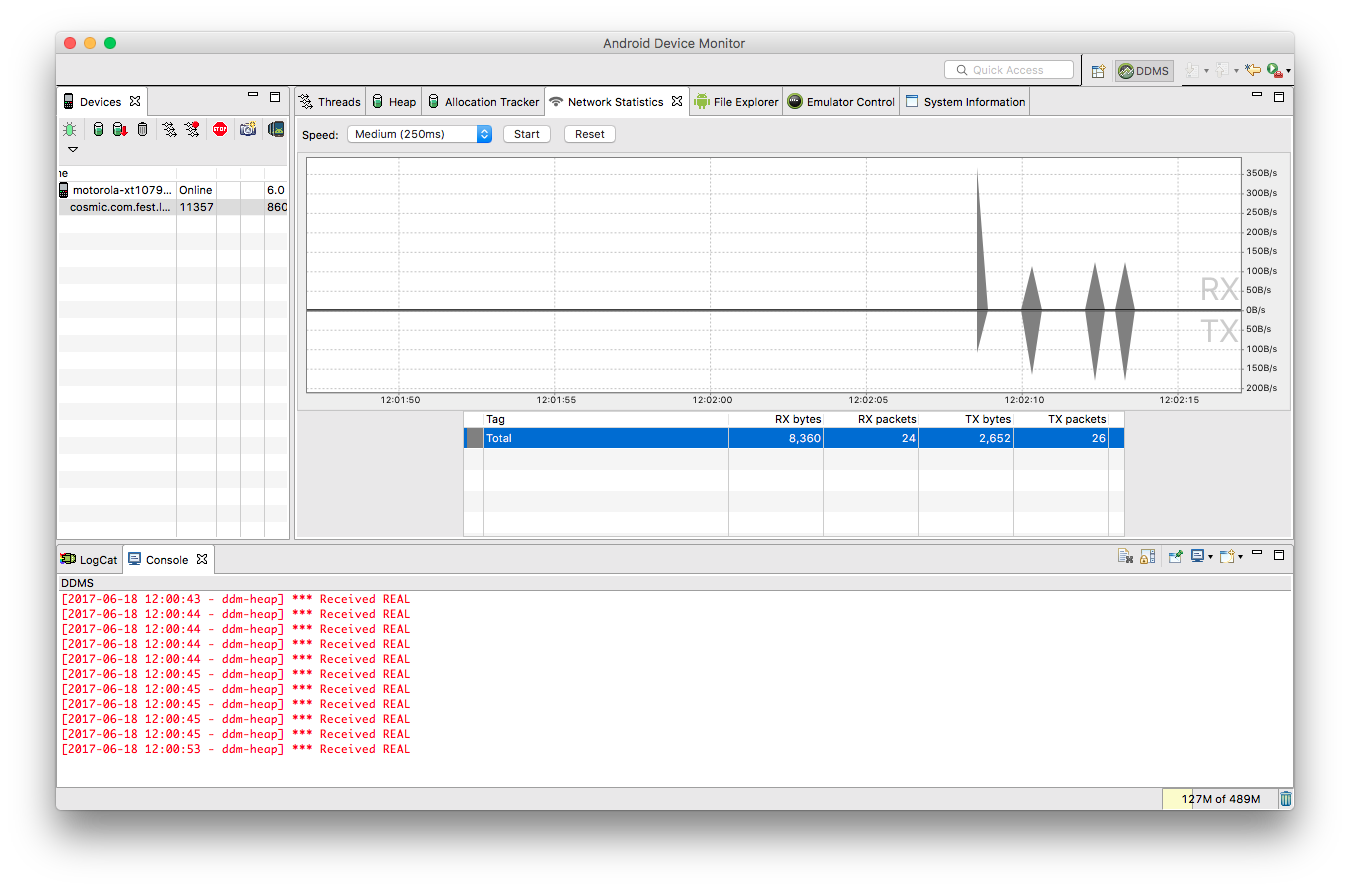
Network Statistics Console
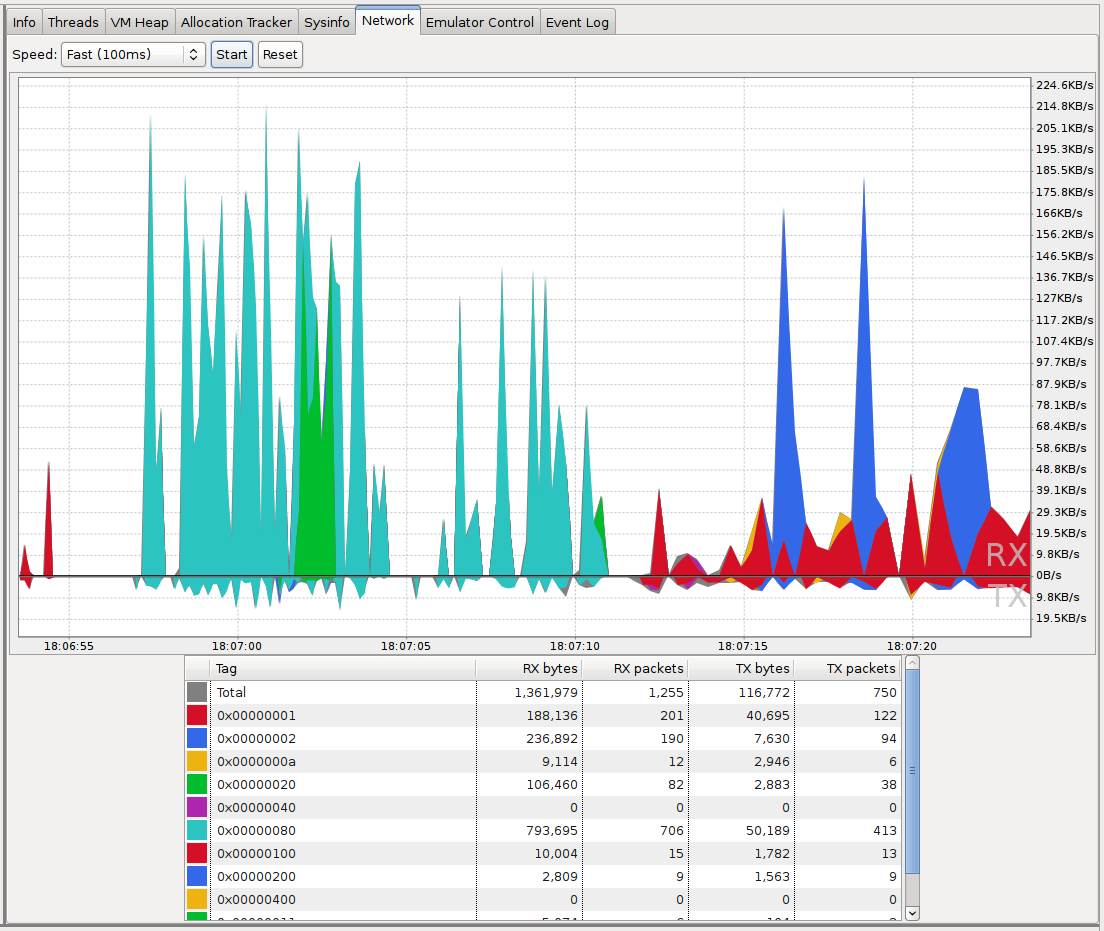
Network statistics is about allowing you to monitor both incoming and outgoing communication channels to your app in a reasonably human-readable manner.
The y-axis in the network chart represents the transmission’s transfer speed measured in KB/second, while x-axis represents elapsed time in seconds. Therefore, to obtain a quick estimate of the transmission’s size, try to estimate the area of the relevant spike. After a while, this becomes rather easy.
Note that, after this console is entered, you will need to click the upper “enable” button for network measurements to start proposing.
Before the network console had matured to the level it is at now, developers usually had to resort to using sniffer apps (some still do) to obtain common information.
The great thing about this console is the way it visualizes one of the major battery draining behaviors—that of ongoing small-packet size communication. As many of you know, what will make your app a battery drainer is not the five minutes of intensive networking that it does, but rather the long periods of short, repeating networking e.g., for the sake of keepalive, diagnostics, or status updates.
Once such a pattern is detected, and the visual packet display of the network console makes it ever so easy, immediately think batching. Can I batch multiple small transmission into a single large one? The battery impact of this change is bound to move apps from a battery-drainer to a well-behaved category!
Tip: Never load an image into memory as is. This is an out-of-memory crash which will happen, eventually. Instead, perform scaled-down loading, or even better, use a third-party library to manage the scaling for you.
Although you will rarely use this information, note that the DDMS relies on the Android Debug Bridge (ADB) stack to pass data back/from the device.
Example of real life DDMS Usage: An app halts (not crashes, just halts). The user immediately rushes to a nearby workstation, connects to USB, and opens DDMS in thread view to find out the thread stack » failed thread » stack trace—in my case, due to synchronization deadlock that, once detected, was easily solved by switching.
Tip: If the standard RAM memory allocated to your app by Android is not enough, as might happen with for example media intensive apps, note that you can gain some 15-20% additional memory on most devices by raising the _largeHeap manifest flag: https://developer.android.com/guide/topics/manifest/application-element.html_
Debugging Android: An Hour Makes a Difference!
Enough theory! It’s now time for some practicals. I recommend, thinking you are an (awesome) Android developer, that from working on your next app you will invest just one hour a week for gaining introspection analysis into your app’s performance via DDMS.
You will be amazed by the amount of quality information (i.e. information which may be used to immediately improve the state of your app) DDMS will provide you with!
Recent Stories


Top DiscoverSDK Experts


Featured Products
Compare Products
Select up to three two products to compare by clicking on the compare icon () of each product.
{{compareToolModel.Error}}
{{CommentsModel.TotalCount}} Comments
Your Comment